

ETH price rally faces potential reversal zone at $4,435 after breaking major resistance levels, traders eye support at $3,400.
Ethereum’s rally has extended into mid-August, with the price climbing above $4,377, marking a 66% surge since July lows. The move has brought ETH close to a key 0.786 Fibonacci retracement level at $4,435, an area where some analysts expect heightened selling pressure.
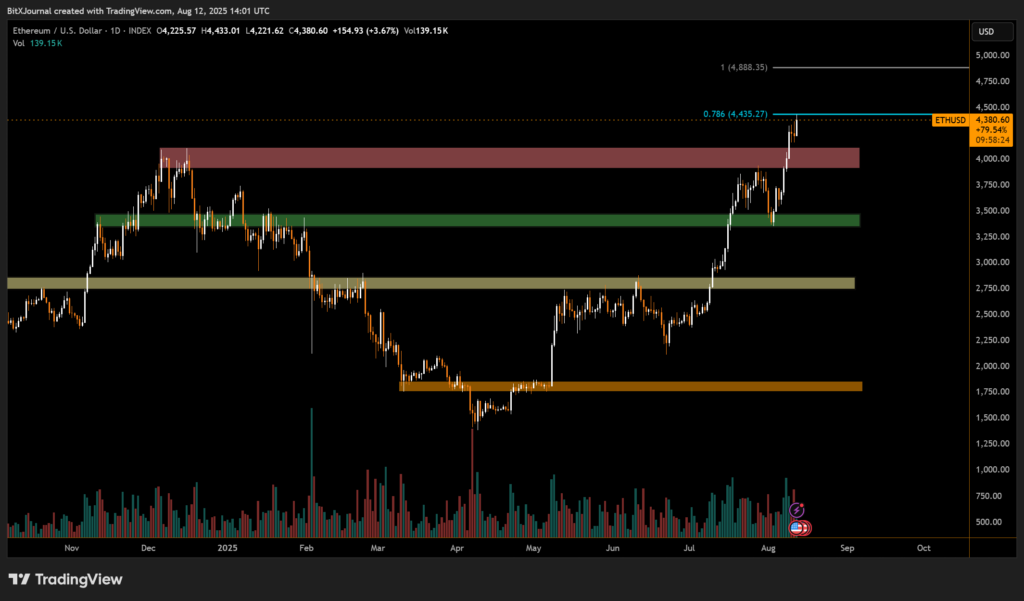
The daily chart shows ETH breaking decisively above long-term resistance at $3,400 (green zone), a level that acted as a ceiling for several months. Price action then cleared the $3,900–$4,050 resistance band (red zone), which previously capped rallies in late 2024.
Trading volume has also expanded during this leg up, suggesting strong market participation. However, the Fibonacci resistance near $4,435 aligns with a historical supply area, raising the possibility of a short-term pullback.
Potential Scenarios Ahead
A sustained breakout above the $4,435 mark could open the door to retests of all-time highs, while failure to hold above recent gains may drive price back toward the $3,400 support. A deeper correction could see ETH revisit the $2,750 zone (beige area), where buyers previously stepped in aggressively.
From a bullish perspective, momentum remains in favor of the upside as long as ETH holds above $3,900 on a daily closing basis. But with the market now testing historically significant resistance, traders are urged to watch for reversal patterns in the coming sessions.
Ethereum’s near-term trajectory hinges on whether bulls can convert the $4,435 level from resistance into support. Until then, volatility is likely to remain elevated, with traders balancing the prospect of fresh highs against the risk of a sharp retracement.
Disclaimer
This content is for informational purposes only and does not constitute financial, investment, or legal advice. Cryptocurrency trading involves risk and may result in financial loss.