
ETH Price Action Nears Critical Resistance
Ethereum (ETH) has posted a strong performance in recent weeks, with the latest weekly candle closing just under $4,900, marking one of the most significant bullish moves of the year. This development signals that the second-largest cryptocurrency by market capitalization may be on the verge of a major technical breakout.
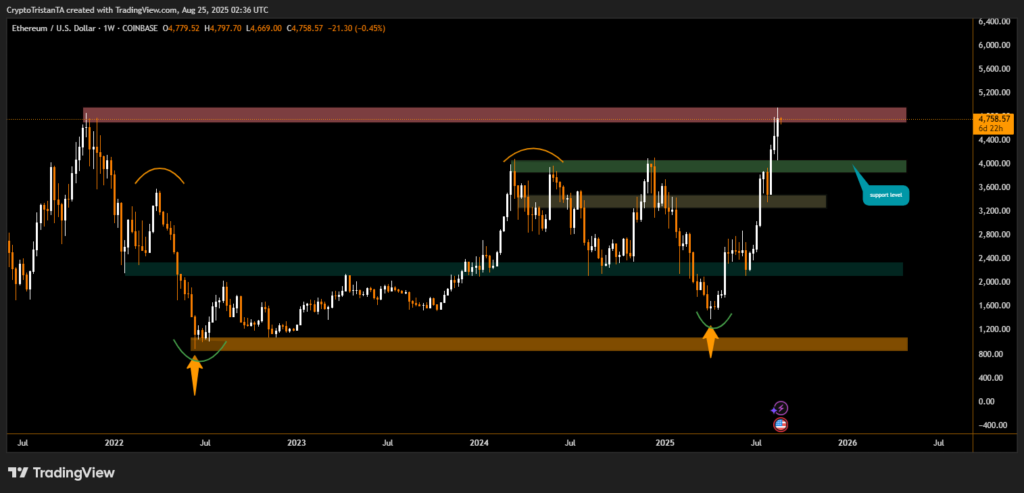
The chart highlights a critical resistance zone around $4,950 to $5,200, which has historically acted as a barrier during previous rallies. A decisive weekly close above this zone could confirm a bullish continuation pattern, potentially opening the door for Ethereum to target new all-time highs.
On the downside, immediate support sits near $3,600, a level that previously served as resistance. A retest of this area could strengthen the bullish structure, provided buyers maintain control.
Experts also point to Ethereum’s historical price patterns, noting that similar setups have preceded multi-month uptrends. “If ETH sustains above $4,900, we could see momentum push it toward the $5,500 level in the short term,” According to BITX .
Traders are closely monitoring whether Ethereum can maintain weekly closes above the $4,900 threshold. A failure to break this zone convincingly could lead to a pullback toward $3,600 support, while a breakout could trigger significant bullish momentum.
As the broader crypto market remains volatile, Ethereum’s current structure suggests a critical inflection point. The coming weeks will determine whether this bullish push turns into a sustained rally or faces resistance from profit-taking pressures.
Disclaimer
This content is for informational purposes only and does not constitute financial, investment, or legal advice. Cryptocurrency trading involves risk and may result in financial loss.