

BNB Chart data Shows Key Support Holding as Market Awaits Direction
Recent price action in Binance Coin (BNB) suggests the asset is entering a critical consolidation phase following a strong rally earlier in the year and a sharp corrective move. The marlket highlights how BNB has transitioned from aggressive upside momentum into a more balanced structure, with buyers and sellers testing key technical zones.
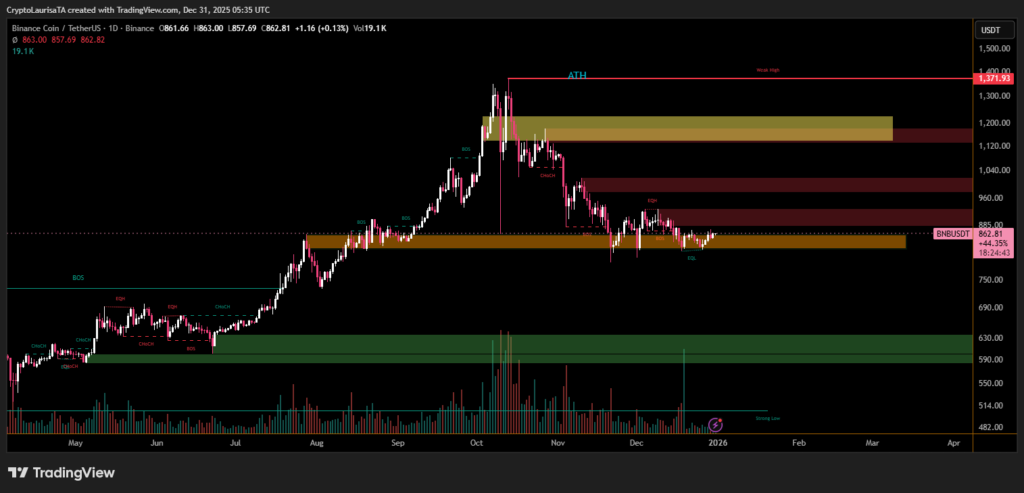
BNB surged toward its all-time high near the 1,370 in 13 oct, where price was clearly rejected. This area now stands out as a major overhead resistance, reinforced by historical selling pressure. Following the rejection, BNB experienced a pronounced pullback, breaking short-term structure and confirming a change of character on the chart.
The decline found temporary relief around the 850–880 USDT range, a zone that has repeatedly acted as both resistance and support in the past. Price is currently hovering near this level, signaling that buyers are actively defending this demand area. Volume has notably decreased compared to the October peak, indicating reduced volatility and a pause in directional conviction.
Below current levels, a strong demand zone between 580 and 630 USDT remains intact. This area represents a deeper support region where long-term buyers previously stepped in aggressively. As long as price holds above this zone, the broader market structure remains neutral rather than decisively bearish.
Disclaimer
This content is for informational purposes only and does not constitute financial, investment, or legal advice. Cryptocurrency trading involves risk and may result in financial loss.