

Bullish Momentum Builds as RSI Turns Positive Across Multiple Timeframes
Bitcoin market indicators are flashing renewed bullish signals, with the Relative Strength Index (RSI) suggesting that a short-term rebound toward the $105,000 level may be possible. While price action remains rangebound, technical data indicates that momentum is quietly shifting in favor of buyers.
A key development is the weekly RSI breakout that occurred in December, ending a three-month downtrend that began in September. The indicator has since held above its breakout level, historically a sign of sustained upside momentum. Similar RSI behavior earlier in the cycle preceded multi-month price rallies, reinforcing the current bullish interpretation.
In an X post on Thursday, trader BitBull noted;
On the two-week timeframe, RSI has flipped bullish from historically low levels, even lower than those seen during the 2022 bear market bottom. This suggests selling pressure has significantly weakened, increasing the probability of a medium-term recovery.
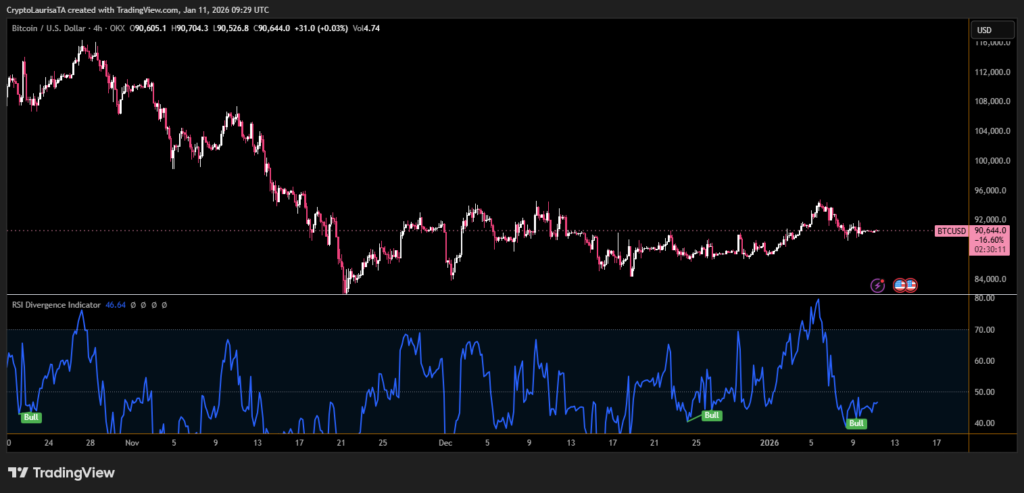
Lower timeframes add further confirmation. The four-hour chart displays a hidden bullish divergence, where price holds higher lows while RSI prints lower lows. This pattern typically indicates exhaustion among sellers as Bitcoin attempts to defend the $90,000 support zone.
Despite improving indicators, some traders still warn of a potential retest of lower support near $75,000 if resistance fails to flip into support.With bullish RSI signals aligning across timeframes, technical momentum suggests Bitcoin could challenge $103,000–$105,000 within weeks, though volatility remains elevated.
Disclaimer
This content is for informational purposes only and does not constitute financial, investment, or legal advice. Cryptocurrency trading involves risk and may result in financial loss.