

Ethereum slipped below the $3,000 threshold this week, extending a multimonth corrective pattern as the market failed to defend its mid-range demand region. The weekly chart shows a steady erosion of bullish structure, with price returning toward levels that have not been tested since early summer.
ETH Technical Breakdown
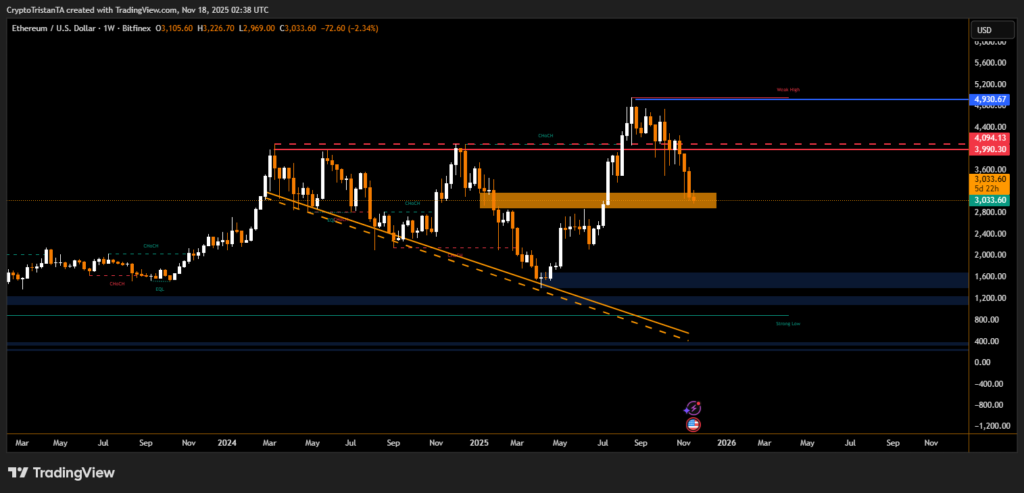
The chart highlights a key failure at the $3,990–$4,094 resistance band, where multiple rallies stalled near the same ceiling. The repeated rejection at that level produced a clear CHOCH reversal, shifting the dominant trend downward.
The decisive move below $3,100 pushed Ethereum under the critical orange demand zone, signaling that buyers have lost short-term control. This region previously acted as a base for the strong rally into the $4,900 area, marked on the chart as a weak high.
BitXJournal market strategist commented, “The market has been struggling to reclaim the mid-range for weeks. The moment ETH closed below the weekly demand block, the path toward deeper supports became unavoidable.”
A descending trendline drawn from last year’s highs reinforces the ongoing bearish structure. The price reacted multiple times to this diagonal resistance before accelerating lower.
Support Zones and Key Levels Ahead
The chart shows layered support bands between $2,400 and $2,800, followed by a broader liquidity pool in the $1,600–$1,800 area. These levels align with previous breakout zones and are likely to attract larger-timeframe buying interest.
BitXJournal technical analyst noted, “If Ethereum cannot reclaim $3,100 quickly, the next magnet becomes the high-volume area around $2,750. Below that, the market will look toward the untouched liquidity sitting closer to $1,800.”
The failure to hold above $3,000 is particularly significant because it marks the first break below this psychological level since the strong mid-2025 rally.
Unless ETH can recover the broken demand zone, the dominant trend remains downward. A weekly close back above $3,300 would be the first sign of stabilizing structure, but momentum currently favors a retest of lower supports.
Ethereum’s dip under $3,000 reflects a shift in larger-timeframe dynamics, with sellers gaining control after several failed attempts to push toward new highs. The coming weeks will determine whether ETH stabilizes above the next demand layer or continues deeper into the lower liquidity ranges.
Disclaimer
This content is for informational purposes only and does not constitute financial, investment, or legal advice. Cryptocurrency trading involves risk and may result in financial loss.