
Technical chart highlights major demand zones as ETH bulls defend critical levels
Ethereum (ETH) is trading around $4,300 after a volatile pullback from recent highs near $4,600. Despite the correction, buyers remain active, defending important support areas on the daily chart. Analysts suggest that these zones could determine the direction of Ethereum’s next major move.
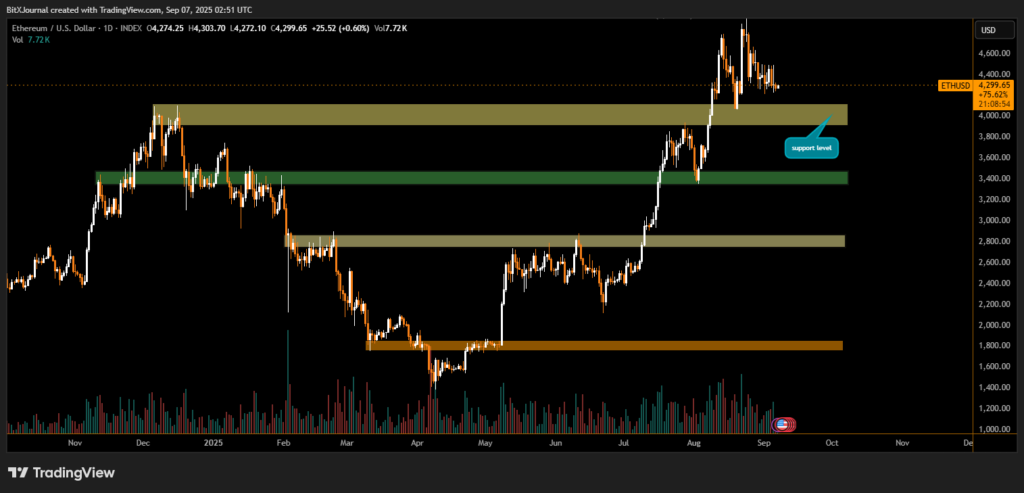
The chart shows a strong support zone between $3,800 and $3,900, where ETH has repeatedly rebounded. This area, highlighted in green, represents a major demand level that could prevent deeper losses if selling pressure increases.
On the upside, resistance appears near $4,600–$4,700, the region where ETH recently faced rejection. A breakout above this range would likely trigger renewed bullish momentum.
BITX market strategist commented, “Ethereum’s price action suggests that bulls are accumulating near $3,800. As long as ETH stays above this level, the medium-term outlook remains constructive.”
The chart also highlights intermediate support zones near $2,800 and $1,800, which acted as historical turning points. While these levels are unlikely to be tested in the immediate term, traders are watching them as long-term safety nets in case of a broader market correction.
According to BITX analysts, “The $4,200–$4,300 consolidation is healthy after such a sharp rally. If ETH clears $4,600, it could aim for new highs, but a daily close below $3,800 would shift sentiment bearish.”
In summary, Ethereum remains in a bullish structure as long as $3,800 holds. A decisive move above $4,600 would confirm strength and potentially open the door to higher levels, while a failure to defend support may trigger deeper retracements.
Disclaimer
This content is for informational purposes only and does not constitute financial, investment, or legal advice. Cryptocurrency trading involves risk and may result in financial loss.