

ETH Technical Update: Demand Zone Holds as Sellers Probe the $2,700 Level
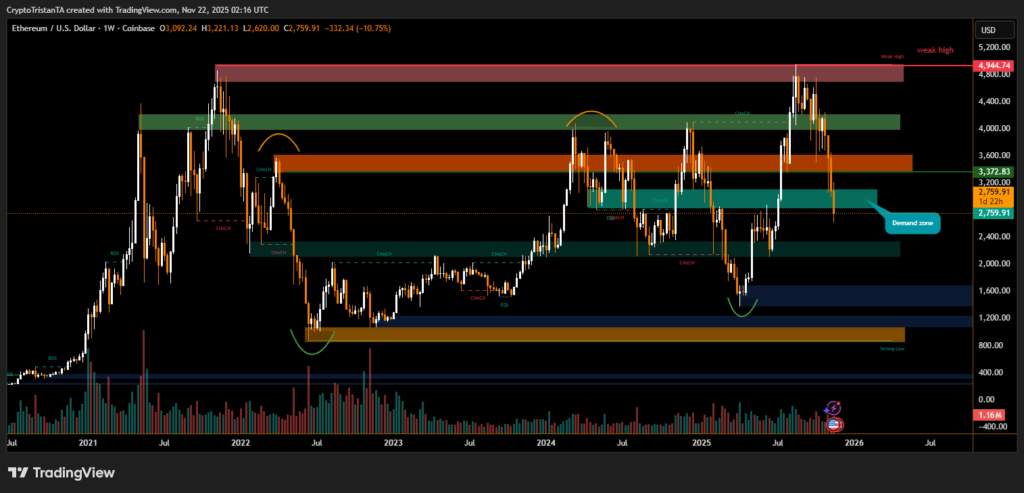
Ethereum is trading around $2,700, a pivotal level shown on the weekly chart where price recently paused against a defined demand zone. The image supplied by the trader highlights layered supply bands above $3,200 and larger support blocks below $2,000. This report summarizes the on-chart structure, what to watch next, and how market participants are interpreting the move.
On-Chart Structure and Key Levels
The weekly chart shows ETH retracing from a recent high into a turquoise demand zone that currently intersects $2,700. Above this, a series of orange and green supply zones cluster between $3,200 and $3,700, forming a clear resistance corridor. Below, larger navy and brown demand areas converge near $1,400–$1,800, suggesting the next strong base if the current support fails.
The critical short-term line is the demand zone around $2,700 — if it holds, buyers can attempt a test of $3,200; if it cracks, the path toward lower demand zones opens.
Market Commentary
BitXJournal technical strategist quoted on the setup said, “Trading around $2,700 is a natural liquidity point. The weekly demand shows buyers are prepared to accumulate, but the cluster of supply above caps meaningful upside until reclaimed.”
BitXJournal market observer added, “Volume on the pullback indicates distribution at higher levels. A reclaim of $3,200 would shift structure for momentum players, while a confirmed breakdown risks a revisit of the $1,500–$1,800 base.”
Trading Implications
For short-term traders, the chart suggests a tactical plan:
- Hold $2,700 for light accumulation and aim for a retest of $3,200.
- Use the $3,200–$3,700 corridor as the main profit-taking area.
- If price falls below the turquoise demand zone, expect increased volatility and potential extension to the lower demand block near $1,400–$1,800.
Ethereum’s current activity at $2,700 sits at a crossroads between a meaningful weekly demand zone and significant supply overhead. The coming sessions will likely reveal whether buyers can absorb selling pressure and re-establish a bullish structure, or whether sellers will force a deeper correction into the larger support clusters.
Disclaimer
This content is for informational purposes only and does not constitute financial, investment, or legal advice. Cryptocurrency trading involves risk and may result in financial loss.